3. Login Chart
 In Login Chart, teacher can view different users' login times such as teachers and students, you could also view all users or sort out by tag. Depends on Teacher's need, chart can be displayed as Line Chart(above) or Bar Chart(below),
  In order to help teachers conduct analysis preciously and effectively, we will elaborate the meaning of every index, and how to apply.
1. People
Teacher can view your tag, other tag or all users' login
2. Time
Teacher can view user login time period, there are several time period such as Last 7 days, Last 14 days, Last 30 days, Last two months, Last three months or Custom time period.
Warm Reminder, we suggest cover less than half year when using "Custom" time period. For example, if you want to view whole academic year login times of all users, it might fail to display as too many data.
 3. Role
Default is view all users' login, teacher can also choose to view teacher or student users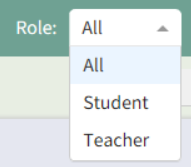 Lastly, teachers can also Export as an excel format, to conduct advance analysis more easily.

